Gradycarter's Blog

Just another WordPress.com site

Tag: Steve Rattner

Saving Young People From Themselves – Steve Rattner

StevenRattner.com: Saving Young People From Themselves


Saving Young People From Themselves

Posted: 13 Apr 2014 11:38 AM PDT

Originally published in the New York Times.

RETIREMENT is a financial obligation that today’s younger generations are not handling well. That may be through no fault of their own — they suffer from lower incomes, after being adjusted for inflation, and student debt that makes it a struggle to save. But regardless of the reason, the failure to save for retirement is setting up Americans in their 20s and early 30s for financially stressed golden years.

The statistics are startling: Only 43 percent of eligible workers under 25, and 62 percent of those between 25 and 34 participate in 401(k) plans, compared with 70 percent or more of those over 45. And the young contribute less — 4.3 percent of income for those under 25 and 5.5 percent for ages 25 to 34. In contrast, Americans between 55 and 64 direct 8.7 percent of their incomes to these plans.

Skimpy retirement assets might be manageable if they were being offset by other wealth accumulation. But that hasn’t happened. In fact, adjusted for inflation, members of Gen Y — those born after 1980 — are poorer than their parents were at similar ages.

We should address this looming crisis via a radical restructuring of our retirement plans, including mandated savings.

While the saving problem may be acute for young people, it’s hardly limited to them. After rising during the financial crisis, the overall savings rate of Americans has once again declined to paltry levels. For those who have saved and invested in equities, the surge in stock market prices since the recession ended has helped, which has pushed up the value of retirement holdings.

But in an unfortunate irony, many millennials, who watched share prices collapse in 2008, then steered clear of the market, thereby missing out on its rise. Typically, these young Americans keep about half of their portfolios in cash — not a sensible long-term investment strategy.

Earlier this year, to take a stab at addressing the retirement issue, President Obama proposed a new form of Individual Retirement Account that would allow Americans with household incomes below $191,000 to put aside money that would accumulate tax free. Unfortunately, the Obama idea is only a symbolic and inadequate gesture. For one thing, its cap of $5,500 per year is too small, and it lacks automatic enrollment or mandatory employer-contribution.

For another, contributions would initially be invested at low Treasury rates. Younger workers should be investing mostly in equities, which, over time, should provide higher returns.

Under the Obama plan, when an individual’s account reached $15,000, funds would be moved into an investment offering from the private sector, which would confront people with the same daunting and unfamiliar choices that face holders of 401(k)s and Individual Retirement Accounts.

A better idea, but still offering only marginal improvement, is the one proposed annually by the president and ignored annually by Congress: requiring employers who do not provide 401(k) programs to offer automatic enrollment in I.R.A.s.

I’d love to see the restoration of defined benefit pensions, which combined automatic saving and sensible, long-term investment strategies. But that’s not going to happen. So at the least, we should take the responsibility for managing retirement funds away from ill-equipped individuals.

To that end, Senator Tom Harkin, Democrat of Iowa, has proposed a plan that would offer a more certain retirement benefit than existing individual plans provide, together with automatic enrollment, universal coverage, portability from employer to employer and professional management.

However, Senator Harkin’s plan has its own flaws — it doesn’t require any employer participation, and participants would be allowed to reduce their contributions or opt out entirely.

The best solution would take up the question of mandated savings. I understand that in today’s world of stagnant incomes, forced savings mean less money for individuals to spend now. But would we seriously prefer that our children become impoverished senior citizens? The approach I like is Australia’s superannuation program, which requires that 9 percent of workers’ pay be diverted into retirement accounts. Tax incentives are also provided, to encourage additional deposits.

The superannuation funds collectively have $1.7 trillion in investment assets. Adjusted for population, that’s the equivalent of $25 trillion for the United States, over twice what Americans have parked in 401(k)s and I.R.A.s. That’s an idea worth considering.

Young Americans are on track to be worse off in retirement than their parents. Let’s not just sit by and watch that happen.

Saving Young People From Themselves.

America in 2013, as Told in Charts

One of my favorite things about there being a “New Year” is that people get a feeling that they can better themselves, and start over somewhat. In order for the yearly reset button to be worth anything at all there must be need for change, and thus we have a reason to ask ourselves about the past and what should stay the same, as well as what needs to change. This article by Steve Rattner addresses our nation with plenty of wonderful words, but even better he also does so with charts! I hope that you enjoy this, and if you don’t I beg of you to kick yourself.

-Grady

America in 2013, as Told in Charts

Posted: 31 Dec 2013 09:45 AM PST

Originally published in the New York Times.

Looking back on 2013, many of the economic and political themes seemed familiar: a weak economy. Growing income inequality. Gridlock in Washington. Partisan wrangling over fiscal policy. But others, like the disastrous rollout of the Affordable Care Act HealthCare.gov website and the government shutdown, were new or at least revivals. Below are 10 charts to illustrate a depressing first year of President Obama’s second term:

Graphic

Not only did trends of recent years continue in 2013 – particularly the diverging fortunes of the rich and everyone else — but in some ways they accelerated. The stock market, as measured by the Standard & Poor’s index, was up a stunning 32 percent (through Dec. 27). Corporate profits rose to a record $2.1 trillion. Meanwhile, incomes remained nearly flat and jobs tallies grew slowly. Through Oct. 30, earnings were up just 1.4 percent, an even smaller increase than in 2012. The only relative bright spot for the average American was housing; thanks in part to the aggressive efforts by the Federal Reserve to hold down interest rates, sale prices of homes were up by 13.3 percent in September, compared with a year earlier.

Graphic

Economic growth — a likely increase in gross domestic product of just 1.8 percent in 2013, after adjusting for inflation — was also unbalanced in other ways, particularly the impact of the government. The nation’s quickly falling deficit (it dropped from $1.09 trillion to $680 billion in a single year) cost dearly in economic activity. Spending by cash-strapped consumers and investment by skittish businesses both grew at slightly below customary rates. A flat-lining Europe dented President Obama’s pledge to double American exports by 2015. On the other hand, home building and related residential activity, depressed since the onset of the financial crisis, provided a second annual lift to the economy.

Graphic

Employment remained an overarching problem. While job growth has picked up steam in the last few months, the fall’s higher pace of job creation – around 200,000 per month – would still not be nearly enough to bring unemployment down to pre-recession levels. According to calculations by the Brookings Institution’s Hamilton Project, even if the 200,000 jobs per month rate were maintained, the unemployment rate would not fall to the November 2007 level of 4.7 percent for another five years.

Graphic

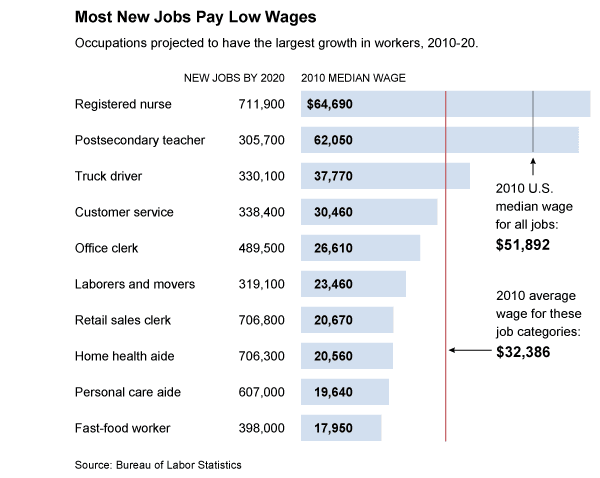
Not only has the job recovery been sluggish, but also a disproportionate number of those that have been created have been in lower wage occupations, such as retail clerks and fast-food workers. And that trend is projected (by the Bureau of Labor Statistics) to continue; using a simple average, the 10 job categories expected to add the most jobs during the current decade boasted a collective median wage of $32,386 in 2010, roughly $15 per hour and far below the United States median of $51,892 at the time. Seven of the 10 categories pay below this average. Note the conspicuous absence of manufacturing; it may be recovering, but it isn’t what is driving new jobs.

Graphic

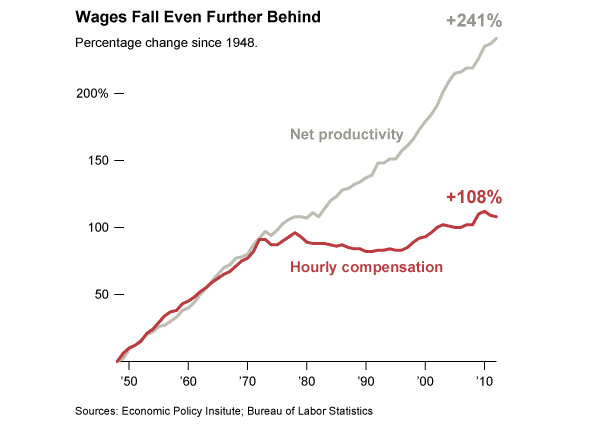
Wage increases haven’t been paltry because the efficiency of the American worker has flagged; indeed, productivity has continued to chug along. But those productivity gains have simply not been passed on to workers. Between 2000 and 2012, productivity rose by 22 percent while wages increased by 7.7 percent. The divergence was particularly great over the last three years of that period – productivity up 4.6 percent and real wages down 1.1 percent. For this failure of the American worker to be rewarded for his growing output, blame a variety of factors, perhaps most important, globalization, which has allowed companies to move production to whatever part of the planet offers the lowest cost labor. In that respect, American workers remain in a race to the bottom.

Graphic

The troubles with the Affordable Care Act’s HealthCare.gov rollout sure grabbed daily headlines this fall. But throughout the commotion, little mention was made of the most fundamental aspect of the law: the way in which it raises nearly $2 trillion over the next decade — mostly from wealthy individuals and health care providers — and uses the money to fund the largest expansion in insurance coverage since Medicare was created nearly 50 years ago. As shown above, the end result should be better health care options for those closer to the bottom end of the income scale, through the Medicaid expansion and creation of exchanges with subsidies for most participants. The intended result: 25 million fewer uninsured Americans. Yes, this is redistribution on a grand scale, and we should all be very proud of it. But as evidenced by Obamacare’s consistently poor poll numbers, most Americans are not feeling charitable toward the less well off.

Graphic

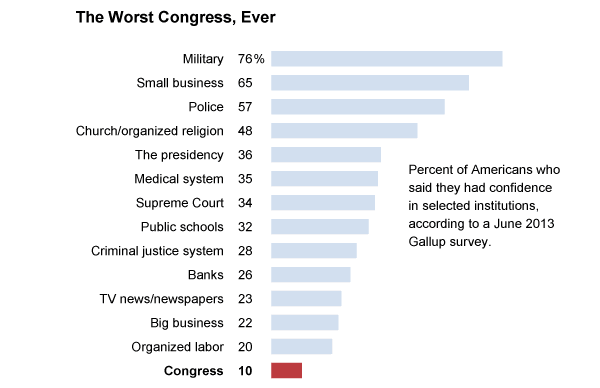
Trust in many American institutions has been declining, but few institutions have fallen so far out of grace as Congress. Last year, I showed that the previous Congress was the least productive Congress in modern times, including the famous Do-Nothing Congress of 1947-48, passing just 238 laws, 37 percent of the average of the 32 Congresses that preceded it. In 2013, the first year of this Congress, the number of new laws passed fell further, to 55 (as of Nov. 30), seven fewer than during the same period in 2011. As a result, Congress now stands dead last in approval rating among key American institutions – far below other braches of government, below news outlets, below banks and even below big business.

Graphic

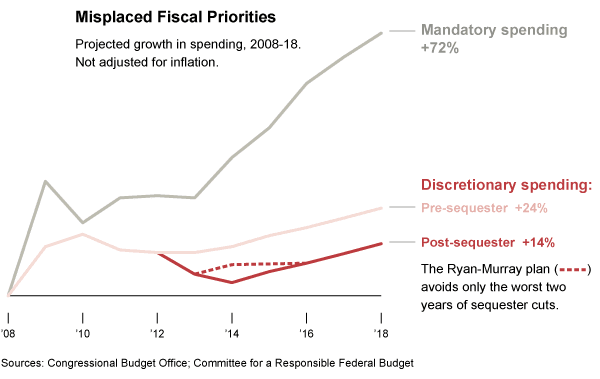
Congress well deserves that poll standing, in significant part because of the damage that it has done to the federal budget. The combination of Republican determination to cut spending and Democratic insistence that none of the entitlement programs (such as Medicare and Social Security) be meaningfully affected has resulted in the utterly inane policy of starving key domestic programs, including education, infrastructure and research and development. The recent budget fight and subsequent agreement did nothing to change that trajectory. As shown by the red line above, all that resulted was avoiding the worst two years of forced budget cuts to these programs; for the 10 years beginning in 2008, this important spending will rise slightly in nominal numbers but will fall by 5 percent, after adjusting for inflation.

Graphic

The dysfunction in Washington has taken its toll in other important ways. Not only has business confidence been shaken, but each new political battle has also been terrifying for consumers. Back in the summer of 2011, when the United States had its AAA credit rating removed by S.&P. after it flirted with default, consumer confidence recorded the second biggest two-month drop ever, behind only the aftermath of Hurricane Katrina. A smaller decline occurred at the end of 2012 when Congress nearly went over a fiscal cliff. Beginning this past July, consumer confidence dropped to its lowest level in nearly two years as a result of the government shutdown, the A.C.A. problems and related battles. Now, a two-year budget nearly in hand, Americans’ moods seem to have improved. At a time when we need consumers to spend (prudently), these periods of faltering confidence have real economic consequences.

Graphic

In contrast to the mood in most of the country and the still slow economy, Silicon Valley is partying again, albeit not quite like 1999. The Facebook initial public offering in May 2012 helped usher in a resurgence of excitement among investors for anything that looks like a sexy new high-tech service. This year’s poster child I.P.O. was Twitter, which set a new record of one kind among recent major technology I.P.O.’s: its valuation of more than 28 times its revenues. That didn’t daunt investors; the stock promptly more than doubled and now trades at 65 times revenues. (Of course, there are no profits.)

The Not So American Dream: Inequality Associated with Immobility – Steve Rattner

If you are reading this you are to some degree or another and consumer. As we live in a capitalistic society, that is fueled by consumers, measuring citizens ability to consume can largely inspire conversation about the true freedom of the citizenry. For decades, particularly the ones in the mid-20th century, consumption (i.e.: driving the car you want, or even just using the cleaning products you might prefer) could be, and has been tied to our nation (and increasingly our world’s) own personal measuring stick of success. Buying power can be conflated with democracy, and people get what it is that they want, regardless of it’s effects on the overall well-being of society – which can be evidenced by things like Cinnabon, and reality television.

Regardless of the consequences of that our wallet shaped ballots can cause us our nation specifically seems to value it’s ability to participate in a “free-market” oriented economy. We refer to this financially stable citizen paradigm as the “American Dream”, which I believe has shifted measurably. I believe that the values of the American public have shifted, which could be measured by observing how our purchasing trends change, but also I believe that the ability to purchase has shifted enormously, which I don’t find to be a simple conspiracy (it’s complicated). Sure, a lot of people in the United States have less money because they don’t work as hard as the maybe used to, but that is an over-simplification. People in the country in general have less money because they also have jobs that have been made more efficient, while the pay rates are not equally increased – but again this is just a part of the picture. Maybe the most impactful factor in regards to a growing wealth gap has been technology, and the replacement of workers by machines and computers. This last one can very clearly be seen in this chart looking at a splitting in correlation of growth from productivity to wages.

Connecting a shift in wages, and productivity is a very important thing to do, but not necessarily just to blame or point fingers at anyone. We just have to be honest with ourselves. Steve Rattner always has wonderful economic charts to help explain what’s going on in this crazy world. These charts below tell a story of how it seems the American dream doesn’t seem quite as American as it used to.

ImageImageImage

11 Financial Tips from Steven Rattner

I love hearing Mr. Rattner’s thoughts on most anything financially related. I appreciate his political perspective in regards to economics, but we rarely, if ever get to hear him talk about personal finances. And as Mr. Rattner has had a very large amount of success on Wall Street (let’s just say that he is worth more than Mitt Romney), I assume he knows a thing or two. Enjoy!

StevenRattner.com: 11 Financial Tips from Steven Rattner
11 Financial Tips from Steven Rattner
Posted: 23 Jul 2013 02:34 PM PDT
Originally published in Esquire Magazine, August 2013 issue

The famed financier — President Obama’s car czar and the manager of Michael Bloomberg’s billions — answers your everyday money questions

Do I need a financial advisor?

Financial advisors are generally brokers — they get paid commissions based on whatever investment activity you generate. The more you buy or sell stocks or other investments, the more the financial advisor usually makes. It may not be in your interest to be buying and selling as often as it’s in his or her interest. So it’s not a perfect situation. The regulatory oversight has improved over the years, but still the people at the bottom of the financial totem pole often end up with financial advisors who are also, frankly, near the bottom of the totem pole. If you can find somebody you have confidence in, who comes well recommended and appears to be qualified, then sure. But if not, you’re better off on your own than with somebody who either is incompetent or isn’t taking your interests to heart.

Should I be doing my own taxes?

If you can, then yes. Many people can use the short form, and there’s TurboTax and other ways to do them. There’s no reason not to do your own taxes if they’re simple enough. My kids do theirs. But you reach a point, as I did, where — even though I like to think of myself as a financially literate person — when you sit down and try to do them, you realize there are accountants for a reason. It’s often a function of how complicated your situation is.

Do regular people really invest in gold?

My first rule of investing is not to invest in things I don’t understand. And I don’t understand gold.

How much debt is too much debt? Which is good and which is bad? Where do i start chipping away?

Very simple: Start getting rid of your most expensive debt first. That’s the closest thing to a formula I can give you.

Apple. Should I be in there?

It’s a terrific company, and their stock has come way down. But what Apple really amounts to is whether you believe it can continue to introduce groundbreaking products. If you do, then the stock is a pretty good buy at the moment. If you think that because Steve Jobs isn’t around or they’ve lost their mojo for one reason or another, they’re not going to have the next great idea, then you should stay away. That said, the average American should not be buying individual stocks. It’s crazy for anybody. I don’t even feel as though I understand what’s going on with Apple, and I pay a lot of attention to it.

Is socially responsible investing still a thing?

I think some people do it. My view of this is you should keep your investing and philanthropy separate. Invest to maximize your returns and to achieve your material needs. Once you’ve done that, feel free to give money away. There’s no evidence that socially responsible investing helps returns, and intuitively you have to believe that it hurts them, because you’re trying to achieve two objectives, and that’s a hard thing to do.

Is my house as worthless an investment as everyone now says it is?

No, you have to put your house in perspective. If you look back at houses over a long period, you’ll see they typically appreciate at the rate of inflation, maybe a little more. The early 2000s were completely anomalous. They ran way up, then came crashing down. You should really look at your house as a low-returning investment that will appreciate over time. It isn’t going to match the rate of appreciation of stocks, and it isn’t going to be huge. But you’re going to get something, and there are tax advantages, too. Look at it as a store of value, but not as a huge investment opportunity.

What’s the best way to ask my parents if they have enough money to retire comfortably?

That’s not financial advice, that’s psychology. I don’t know your parents, so I don’t know the best way to ask them, but here’s something to consider: I’ve seen a bunch of research recently that says that as you look across the older generations — particularly the people who came of age in the Depression and have a certain mentality because of it — they’re much better prepared financially than younger generations seem to be if you look at assets relative to where they are in life. It’s important to try, depending on how old your parents are, to have them see clearly what some financial issues might be. But more importantly, think about them for yourself.

Do I need to worry about the euro crisis?

In a general sort of way. First it depends on how active an investor you’re going to be. If you’re going to start picking parts of the world to invest in, you’re going to have to worry about it a little more. If you’re not, then probably worry about it less. It has already had and will continue to have an effect on the U.S. because we export a lot to Europe, and those exports have been negatively affected by the economic situation there. Part of why our economic recovery has been slower than we’d like is that the rest of the world’s economic situation has been more challenged. So yes, you should worry about it just as a part of being generally well informed, and you should worry about it because it does have consequences for us. But unless you’re picking stocks every day, that’s as far as you need to go.

Is tracking every penny I spend worth the time and effort?

I think to be conscious of where your money is going is a good idea. When I was younger, I kept a close watch, and even now I look at what I spend money on, although certainly not to the penny anymore. I think doing it at least for a while to get a feeling of where your money is going is a good way to get a better sense for how to allocate what you have. There’s no other way that I know to budget thoughtfully. Plus, it’s easier these days, with online banking — it’s all right there. When I was younger, we wrote checks out, kept track of our account balances, and didn’t have automatic overdrafts — any of that.

My fifth grader is being taught about the Great Depression, and she asked me, when the stock market crashed and people lost all their money on Wall Street, where did it go? How would you answer that?

It didn’t go anywhere because those people never had the money. What they had were shares of stock in companies. The problem in 1929 — and again in 1999 — was that people paid more for the shares than what the assets that were represented by the shares were worth. So eventually people stopped buying shares and the prices collapsed.

The New Economic Risk: Complacency – Steve Rattner

A couple of my favorite political things collided in this article: Steve Rattner, and No Labels (who I used to work for). I’d be very interested to know what kind of measures might be proposed as Mr. Rattner suggests in this article.

The world is complicated, so while reading about large often controversial topics like the ones discussed in this article I suggest attempting to observe yourself, and whether or not you have your mind made up before you read about such challenging things or not.

The New Economic Risk: Complacency

Posted: 21 Jun 2013 07:06 AM PDT

Originally published in the New York Times

With each month of steady employment growth — in May, 175,000 jobs were created — the feeling of lassitude around the issues facing the American economy takes hold a little bit more.

Amid the gathering drumbeat of pronouncements of economic optimism, most dramatically from the Federal Reserve Board on Wednesday, the feeling of dread that used to bubble up in the moments before each month’s jobs report has largely dissipated.

That’s good news, certainly. But still, the thing that has replaced our collective dread may be even more dangerous in the long run — and that’s complacency. The slowness of our economic recovery should remain our biggest national worry, particularly as that sluggishness is manifested in inadequate job totals and stagnant incomes.

For example, the Hamilton Project, a research group based at the Brookings Institution, has calculated that on the current trajectory, it would take until October 2022 for the unemployment rate to return to its level at the end of 2007, just before the recession began, when it stood at 5 percent.

That would mean nine more years in which too many Americans without steady incomes struggled to make ends meet.

Even if the rate of job growth accelerated to 200,000 per month, it would still take until late 2020 to get the nation back to full employment.

Equally concerning is the stagnation of wages. Over the past four years, the average incomes of Americans (after adjusting for inflation) have remained mired at 2008 levels. With income inequality incontrovertibly rising, that means that most Americans have suffered cuts in their purchasing power.

20130622-020756.jpg

But here’s the really incredible part: despite these worrisome facts, Congress has been doing nothing, absolutely nothing, to address the problem.

Or of late, any of the nation’s real problems. The 112th Congress, which ended on Jan. 3, passed 17 percent fewer bills than any previous Congress since 1948 (and possibly even before that), according to the Library of Congress. And this Congress is already off to a slower start than its predecessor.

20130622-020819.jpg

Small-government conservatives may view this as good news; the less government does, the happier they say they would be. I have a different opinion. I believe we have plenty of challenges and that it’s Congress’s job to address them.

For his part, President Obama has been faithfully unfurling proposals, including major ones during the last presidential campaign and in his new budget, released in April. And since early spring, he has tried to mobilize public opinion by journeying to places like Austin, Tex., Baltimore and Mooresville, N.C., on his “Middle Class Jobs and Opportunity Tour.”

But neither the tepid economic data nor the president’s exhortations have moved Congress. After demanding that the Senate Democrats pass a budget for the first time in four years, a clutch of important Republican senators are now refusing to participate in the next procedural step, a conference committee between the houses of Congress to reconcile their competing budget proposals.

So instead of pounding out thoughtful policy, Congress hurtles toward the next fiscal crisis — a double showdown this fall over financing the government for the next fiscal year, which begins Oct. 1, and over raising the debt ceiling that limits the federal government’s ability to borrow money to finance its budget deficit.

No one should be surprised, then, that the American people’s confidence in Congress has now dropped to 10 percent, the lowest on record.

20130622-020846.jpg

It’s time for Congress to do something. That doesn’t mean that I’m signing up with those who advocate a Japanese-style exercise of scattering huge sums of government money willy-nilly to try to stimulate the economy. That may provide a short burst of energy, but it would compound our debt problem — yes, we still have a big one — without offering long-term relief.

Happily, there’s no shortage of smart policy programs that, for small amounts of money (at least some of which could come from trimming other parts of the budget), could address the structural problems that are holding back our jobs recovery.

For example, last week, the left-leaning Center for American Progress released an exhaustive compendium of ideas, some of them hugely idealistic (like overhauling the tax code), but others quite manageable in the short term. One such idea is to reprogram education spending to better target science and engineering — areas where the next generation of jobs is likely to emerge.

Similarly, President Obama’s latest budget provides for long-term deficit reduction while carving out additional funding for critical needs like establishing an infrastructure bank.

And yet, Congress has let these and other good ideas wither on the vine.

Maybe the solution is to borrow one good idea from Republicans. At Republican leaders’ insistence, an earlier budget deal included a requirement that lawmakers’ salaries be held in suspension if the Senate and House did not each pass a budget. The threat seemed to work: both chambers passed one.

Now it’s time to extend that concept to force Congress to do something to spur job growth and prepare the next generation of American workers — something, that is, other than the misguided sequester now in place.

Morning Joe Charts on Government Printing and Buying Money – Steve Rattner

StevenRattner.com: Morning Joe Charts: Fed
Morning Joe Charts: Fed

Posted: 20 Jun 2013 11:55 AM PDT

If you have time I recommend watching the video by clicking on the link below.

On yesterday’s Morning Joe, Steven Rattner discusses the growing number of bonds purchased by the Fed in its efforts to stimulate the economy. He shows how markets have reacted to Ben Bernanke’s pronouncements that the Fed will begin tapering down its bond-buying program should the economy continue to improve. Click here to view the video.

(Note: Red bulls-eyes on the last chart indicate statements made by Bernanke.)

20130621-104721.jpg

20130621-104732.jpg

20130621-104740.jpg

The three dots in the chart above represent times when Chairman of the Federal Reserve Ben Bernanke has spoken publicly. The most recent example of this showed some short term turmoil on the stock market.

20130621-110044.jpg

20130621-110056.jpg

Deficit Reduction, Minus the Reduction – Steve Rattner

Deficit Reduction, Minus the Reduction.

This was published in the New York Times on April 11th, 2013, but I thought that it was worth sharing. This type of policy debate is not simple, but that doesn’t mean that people shouldn’t try to know about it, And Steve Rattner puts it into a great perspective. So maybe just give it a quick look.


Deficit Reduction, Minus the Reduction

Authors@Google: Steven Rattner

Rattner’s Google Author Talk

20130312-095921.jpg

I love posting Rattner’s Charts, so I figured it’s probably time for some folks to listen to Steve Rattner themselves. As the car czar during the auto bailout, and a very prominent member of Wall Street I think that he has a very unique and clear perspective on public policy and business, and he seems to articulate their relationship in a very reasonable manor. I hope you enjoy:

The Top 1% of the Top 1% in Charts – Steve Rattner’s Morning Joe Charts (02-20-2013)

The Top 1% of the Top 1% in Charts – Steve Rattner’s Morning Joe Charts (02-20-2013)

I would love to explain this, but I will just let Steve and the charts speak for themselves.

Morning Joe Charts: Middle Class – Steve Rattner

Morning Joe Charts: Middle Class – Steve Rattner

These charts tell a very sad story about our nation, and part of the problem is that it’s not simple. Debating the cause of these trends is very worthwhile, but we first must admit that this is part of what we face. We live in an increasingly expensive world, and money seems to be harder and harder to come by.

1 Falling Median Incomes 2 Declining Median Worth 3 Riding Debt Levels for Families 4 Tempered Optimism for the Next Generation